Class Date: 9/16/2025 -- In Class
Teaching: 90 min
Exercises: 30 min
Questions
How do I write code to make decisions about data?
How do I use the same code to treat different data sets in different ways?
How can I perform the same operations on multiple data sets or across multiple subsets of a single dataset?
Objectives
Write conditional statements with if(), else, and ifelse().
Correctly evaluate expressions containing && (“and”) and || (“or”).
Use a for loop to repeat an analysis across different data subsets or to process multiple files.
Use list.files() to get a list of filenames that match a simple pattern.
Understand the basic purpose of regular expressions and where to go to learn more.
Explain the basic process underlying what a for loop does.
Correctly write for loops to repeat simple calculations.
In Class
Our previous lessons have shown us how to read and manipulate data, define our own functions, calculate basic statistics, and generate basic charts. However, the programs we have written so far always do the same things, regardless of what data they’re given. We want programs to make choices based on the values they are manipulating.
Conditionals
In order to have the output of a script depend on specific attributes of the input data, we need to write code that automatically decides between multiple options. The tool R gives us for doing this is called a conditional statement, and looks like this:
The second line uses an if statement to tell R that we want to make a choice. If the test following if in parentheses () is TRUE, the body of the if–the line(s) of code contained in the curly braces {}–are executed. If the test is FALSE, the body of the else is executed instead. Only one or the other is ever executed (never both):
In the example above, the test num > 100 returns the value FALSE:
num>100
[1] FALSE
which is why the code inside the if block was skipped and the code inside the else statement was executed instead.
Conditional statements don’t have to include an else. If there isn’t one, R simply does nothing if the test is FALSE:
if(num>100){print("num is greater than 100")}
We can chain several tests together when there are more than two options. Let’s use this to write a function that returns the sign of a number:
Note that when combining else and if in an else if statement, the if portion still requires a direct input condition to specify the conditional test. This is never the case for the lone else statement, which is only executed if all other conditions go unsatisfied.
We can combine logical tests using relational operators. Two ampersands, &&, symbolizing “and”, or two vertical bars, ||, symbolizing “or”, can be used to test whether two separate tests are both true (&&):
if(1>0&&-1>0){print("both parts are true")}else{print("at least one part is not true")}
[1] "at least one part is not true"
or if either test is true (||):
if(1>0||-1>0){print("at least one part is true")}else{print("neither part is true")}
[1] "at least one part is true"
In this case, “either” means “either or both”, not “either one or the other but not both”. If you want the latter, use the exclusive or (xor()) function.
R includes the function ifelse() to make if/else statements more efficient in certain circumstances.
?ifelse
The first argument is the if test, the second is the code to execute if the test is TRUE, the third argument is the code to execute if the test is FALSE. This format is also vectorized, which provides us a useful way to run the same if/else statement on each element of an input vector. Let’s use our carSpeeds data set to repeat the replacement of "Blue" with "Green" in the car color variable, as we did in an earlier lesson, but this time using ifelse():
  Color Speed     State
1  Blue    32 NewMexico
2   Red    45   Arizona
3  Blue    35  Colorado
4 White    34   Arizona
5   Red    25   Arizona
6  Blue    41   Arizona
# replace all "Green" entries in the Color column with "BluecarSpeeds$Color<-ifelse(carSpeeds$Color=='Blue','Green',carSpeeds$Color)head(carSpeeds)
  Color Speed     State
1 Green    32 NewMexico
2   Red    45   Arizona
3 Green    35  Colorado
4 White    34   Arizona
5   Red    25   Arizona
6 Green    41   Arizona
Choosing Plots Based on Data
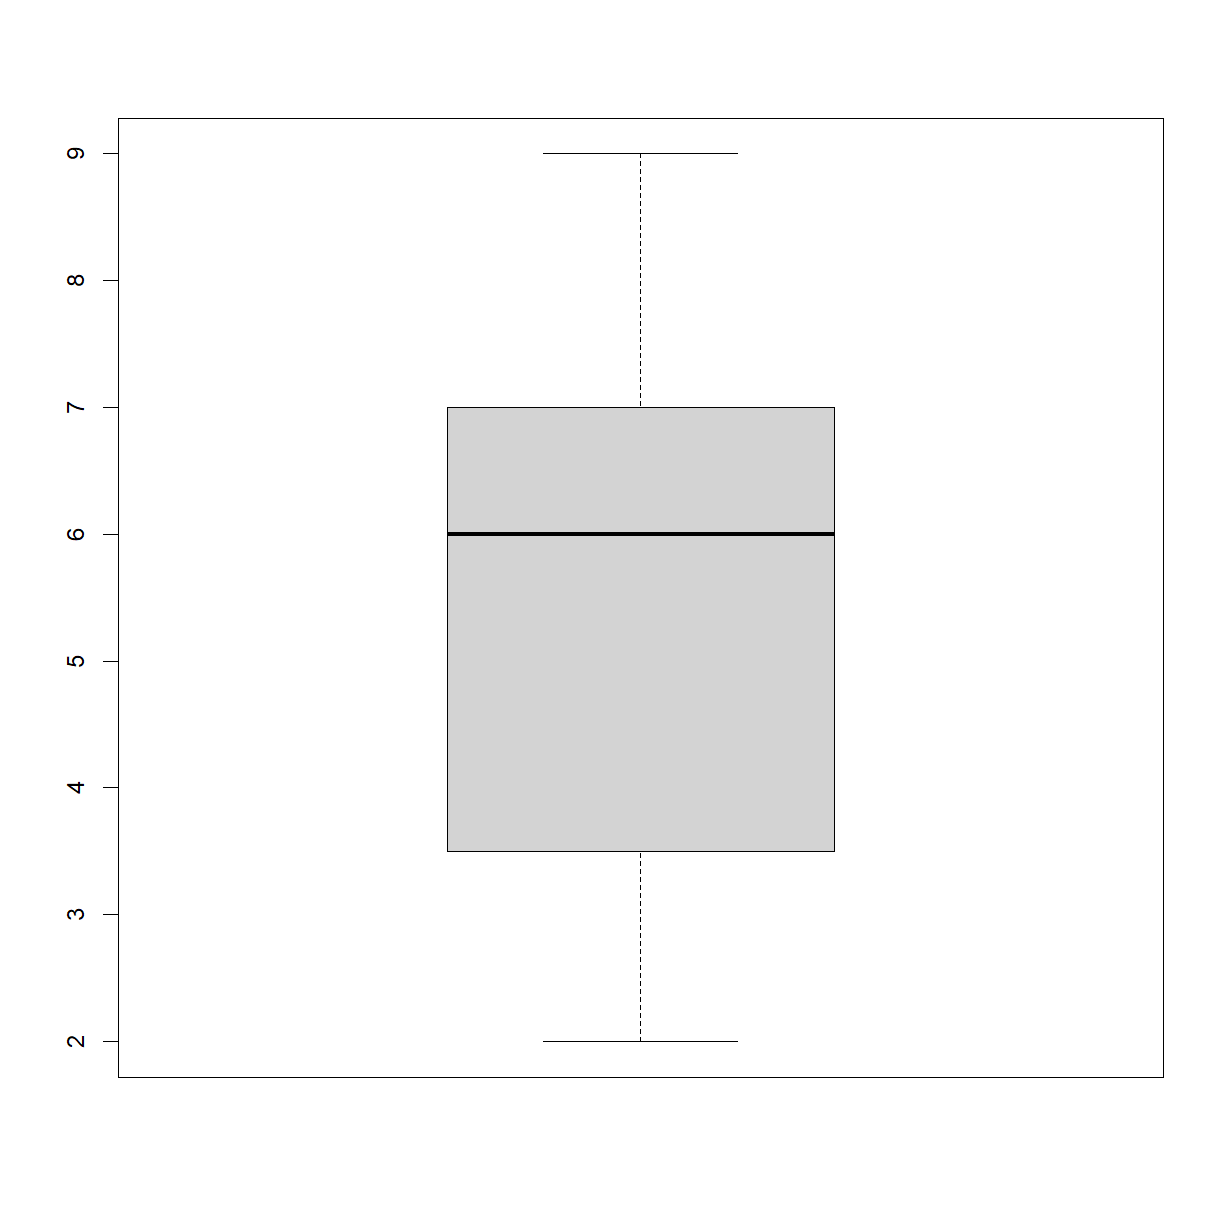
Write a function plot_dist() that plots a boxplot if the length of
the vector is greater than a specified threshold (e.g. the vector contains more than 10 data points) and a stripchart otherwise.
To do this you’ll use the R functions boxplot() and stripchart().
For instance, your function should have the following behavior when presented with subsets of the data from the inflammation-01.csv data set:
dat<-read.csv("data/inflammation-01.csv",header=FALSE)plot_dist(dat[,10],threshold=10)# day (column) 10
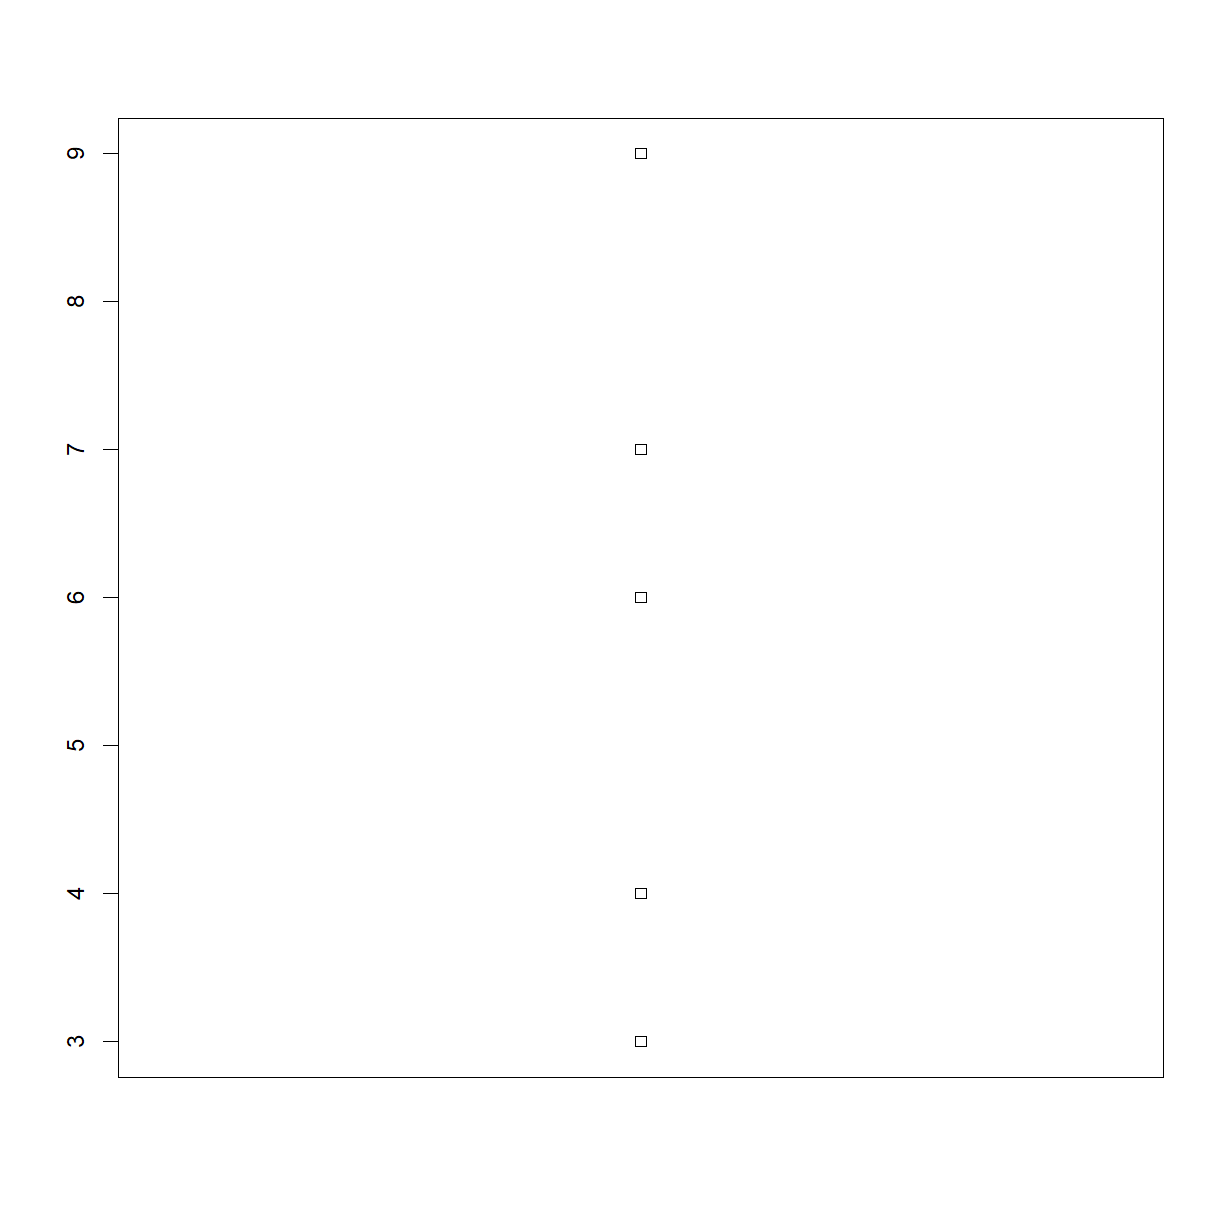
plot_dist(dat[1:5,10],threshold=10)# samples (rows) 1-5 on day (column) 10
It doesn’t scale: if we want to print the elements in a vector that’s hundreds long, we’d be better off just typing them in.
It is not robust: if we give it a longer vector, it only prints part of the data, and if we give it a shorter vector, it returns NA values because we’re asking for elements that don’t exist.
This takes few lines of code to produce–especially if we were to create a version of print_words that prints every character in a hundred-word vector–and more robust as well:
The improved version of print_words uses a for loop to repeat an operation—in this case, the print() function—once for each thing in a collection (i.e. each element in the best_practices character vector.
The general form of a for loop is:
for(variableincollection){dothingswithvariable}
We can name the loop variable anything we like (with the usual restrictions on variable names). The in is a formal part of the for syntax and required.
Note that the condition (variable in collection) is enclosed in parentheses, and the body of the loop is enclosed in curly braces { }, similar to if statements. For a single-line loop body, as here, the braces aren’t actually needed,
… but it is a best practice to include them as we did, because it avoids ambiguity.
Here’s another loop that repeatedly updates a variable in order to count the number of entries in a vector, carrying out the the same task as the length() function:
# define the vector of interestvowels<-c("a","e","i","o","u")# initialize a variable to store the current value for length during# each iteration of the looplen<-0# execute the for loopfor(vinvowels){len<-len+1}# Display the calculated vector lengthlen
[1] 5
It’s worth tracing the execution of this little program step by step:
Since there are five elements in the vector vowels, the statement inside the loop will be executed five times.
The first time around, len is zero (the value assigned to it on line 1) and v is "a".
The statement adds 1 to the old value of len, producing 1, and updates len to refer to that new value.
The next time around, v is "e" and len is 1, so len is updated to be 2.
After three more updates, len is 5; since there no remaining elements in the vector vowels, the loop finishes.
Note that a loop variable is just a variable that’s being used to record progress in a loop. Even though we don’t explicitly use the value of v in the code within the braces, it is still defined and updated during each loop. The value of v will also be retained after the loop is over, and we can re-use variables previously defined as loop variables as well:
# start with "letter" definedletter<-"z"# execute a for loop that uses "letter" as the loop variablefor(letterinc("a","b","c")){print(letter)}
[1] "a"
[1] "b"
[1] "c"
# after the loop, letter is:letter
[1] "c"
Note that length() is much faster than any R function we could write ourselves, and much easier to read than a two-line loop; it will also give us the length of many other things that we haven’t seen yet, so we should always use it when we can. Whenever possible, use available functions before creating your own.
Exercises
Printing Numbers
Write a function that prints the first N natural numbers, one per line:
In many real world datasets, you will want to process a series of files that contain data in the same format using the same set of analysis steps. for loops are a useful tool for this purpose.
In the data folder we have a series of files containing information about inflammation. These files give data on patients treated with a new drug for arthritis. Each file contains a series of patients (in rows) with a series of inflammation measurements on subsequent days (in columns). Each file contains information from the same set of patients on different rounds of treatment. We looked at the first file in this series previously. Let’s read in the file to recall the data format:
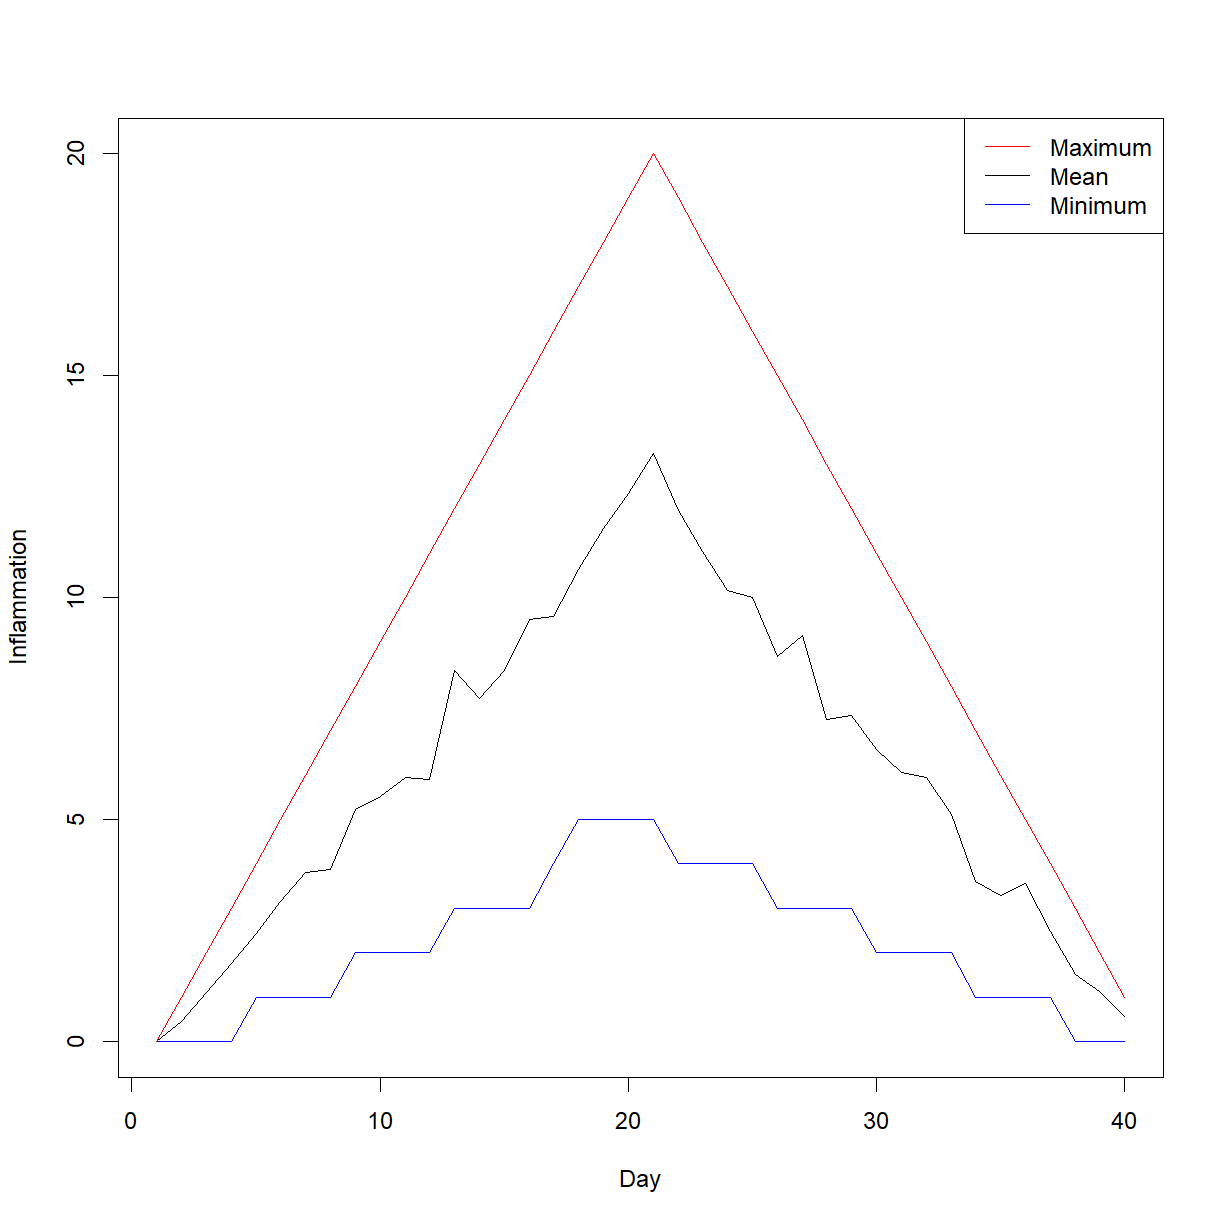
To begin, let’s calculate and plot the minimum, maximum, and mean inflammation across patients for each day:
# use apply to calculate min, max, and mean inflammation for each day and save them to variablesavg_day_inflam<-apply(inflam1,2,mean)max_day_inflam<-apply(inflam1,2,max)min_day_inflam<-apply(inflam1,2,min)# ------------------------------------------# Plot min, max, and mean on the same chart # (using different line colors)# First we need to grab the overall maximum # and minimum values in our data set to be # sure we make the plot window big enoughy_min<-min(inflam1)y_max<-max(inflam1)# first initiate the plot with "min" dataplot(min_day_inflam,# plot minimum firsttype="l",col="blue",# plot the minimum as blue linesxlab="Day",ylab="Inflammation",# axis labelsylim=c(y_min,y_max))# define plot limits# use the lines() function to add max and mean to the current plotlines(avg_day_inflam,col="black")lines(max_day_inflam,col="red")# add a legendlegend(x="topright",# location on chartlty=1,# this tells R to make lineslegend=c("Maximum","Mean","Minimum"),# define/order the labelscol=c("red","black","blue"))# define/order the colors
The chart looks good, but something is strange with the data. The maximum measurement across patients appears to increase exactly linearly up to day 20, then decline exactly linearly thereafter. The minimum value looks to stair-step up to day 20, then stair-step down thereafter.
Does this happen with all the files? Let’s write a script to run the above analysis on all files and save the resulting report to a PDF file. For this, we can use our for loop capability to carry out the following steps:
Identify a list of files with a similar naming pattern.
Initiate a PDF file for capturing the output plots.
Set up a for loop to process each file in the list.
For each file, complete the following steps:
a. Calculate minimum, mean, and maximum across patients for each day.
b. Generate a plot of minimum, mean, and maximum inflammation across the time course for each file.
Finalize the PDF file with dev.off().
The first point requires that we have some way to recognize patterns in file names. This can be accomplished with the list.files() function, which we looked at briefly in an earlier lesson.
?list.files
We can use the pattern argument to specify a search pattern using regular expressions (aka regex), which is a systematic language for searching strings of text. For, example, we can use the pattern argument to look for all .csv files:
Almost, but not quite there. If we want to be more specific, the search string gets a bit more complicated. If we want to extract all examples from a list that start with “inflammation-“ and end in “.csv”, (but contain anything else in between), we can use the following regex terms:
^ indicates the beginning of a string.
.* is a wild card, specifying that any type or length of character can occur in this place.
$ indicates the end of a string.
Regular Expresssions (regex)
The use of regex can be very powerful in allowing scripts to identify
specific characteristics in textual data.
Regular expression are a whole separate language unto themselves
and there are many resources online for learning to use and test
regex. Here are a couple that I have used:
regexr – an online tool that let’s you test out a regular expression against a text string.
RexEgg regex cheat sheet – a regex cheat sheet that I have found useful (and some other resources as well).
We will also add the full.names argument to tell list.files() that we want it to return the full path to each file name, not just the file name itself:
Now we have a way to pull just the “inflammation” file names out automatically and assign them to a variable, which we can use later. Now that we have the last piece of the puzzle, we can build our loop. The output will be saved to a PDF file with a page graphing the maximum, mean, and minimum inflammation value across patients over time for each file.
# First, grab our file list using pattern matchinginflam.files<-list.files(path="data",pattern="^inflammation-.*.csv$",full.names=TRUE)# Initiate the PDF file to store the graphspdf(file="results/inflammation-by-file.pdf",height=5,width=5)# Start the for loop to cycle through the filesfor(file.cininflam.files){# read in the current fileinflam.c<-read.csv(file=file.c,header=FALSE)# calculate min, mean, and max values by dayavg_day_inflam<-apply(inflam.c,2,mean)max_day_inflam<-apply(inflam.c,2,max)min_day_inflam<-apply(inflam.c,2,min)# Plot min, max, and mean on the same chart for this day# look up max and min values for complete day to set plot sizey_min<-min(inflam1)y_max<-max(inflam1)# first initiate the plot with "min" dataplot(min_day_inflam,# plot minimum firsttype="l",col="blue",# plot the minimum in bluexlab="Day",ylab="Inflammation",# axis labelsylim=c(y_min,y_max))# define plot limits# use the lines() function to add max and mean to the current plotlines(avg_day_inflam,# plot mean secondcol="black")# draw mean in blacklines(max_day_inflam,# plot maximum secondcol="red")# draw maximum in red# add a legendlegend(x="topright",lty=1,# use lines of style 1 (solid)legend=c("Maximum","Mean","Minimum"),# order the labelscol=c("red","black","blue"))# define colors in label order}# finalize the PDF file by turning off the graphics devicedev.off()
Key Points
Use if (condition) {take action} to start a conditional statement, else if (condition) {take alternative action} to provide additional tests, and else {take alternative action} to provide a default alternative.
Use == to test for equality.
X && Y is only true if both X and Y are true.
X || Y is true if either X, Y, or both, are true.
Use for (variable in collection) {take repeated action} to process the elements of a collection one at a time.
Use regular expressions (regex) to perform pattern searches in textual data.